Fiber Section Analysis
The nonlinear fiber section analysis in StructuralMind divides a section into many small pieces, assigns each piece its own strain and the stress that corresponds to it, then sums them and solves for equilibrium with the forces acting on the section. The capacity therefore comes out of the material curves themselves rather than out of a single closed relation. What that buys is the ability to choose how concrete and steel actually behave, and to see not only the moment a section carries but the curvature at which it gets there.
Creating the calculation
To analyse a reinforced concrete section, pick Fiber Section Analysis in the Calculation Gallery and add it to your project with "Start Calculation". The screen splits in two: the input panel on the left, four tabs on the right — Section, Moment-Curvature, Interaction Diagram and Material Curves.
The input panel has six sections. You can enter the data working down them in a logical order.
| Section | Data you define |
|---|---|
| Section Geometry | Section type, dimensions and cover |
| Reinforcement Layout | Diameter, count and placement of the longitudinal bars |
| Stirrup Layout | Stirrup type, diameter, spacing and leg count |
| Prestressing Reinforcement (Strand) | Strand placement, area and prestress force |
| Material | Core concrete, cover concrete and reinforcing steel, plus the material factors |
| Analysis Parameters | Axial load and bending angle |
Section geometry
The type selector offers three section types: Rectangular, Circular and Hollow Circular —
rectangular, circular and circular_hollow in the API.
For a rectangular section you enter the width and height, then the cover separately for the top, bottom and side faces. A circular section needs a diameter and a single cover; a hollow circular one needs the outer diameter (D_outer), the inner diameter (D_inner) and the cover.
⚠️ Changing the section type does not only change the dimension fields; the reinforcement layout and the stirrup layout also revert to the starting values of the new section type. Choose the section type first.
Reinforcement layout
Turn off the Use Reinforcement option in this section and the longitudinal bars are dropped. That is how you define a section carrying prestressing strands only.
On a rectangular section you can use either of two bar placements.
| Layout | How you define it | Where it can be used |
|---|---|---|
| Symmetric (column) | The diameter and count of the corner bars are entered, along with the diameter and per-face count of the intermediate bars in X and Y | Column sections whose opposite faces carry the same reinforcement |
| Face-by-face (beam) | A separate diameter and count are entered for the top, bottom, left and right faces | Beam sections whose top and bottom reinforcement differ |
In the face-by-face layout the count you enter for the top and bottom faces also includes the corner bars. The count for the left and right faces covers the web bars only. The four corner bars need not share a diameter: the top corners use the top face's diameter and the bottom corners the bottom face's.
On a circular or hollow circular section a single diameter and count are enough. The bars sit at equal angles around the perimeter, and at least four bars are expected.
Stirrup layout
On a rectangular section you can set the stirrup type as single, double, triple or diamond (cross) stirrup. Alongside the diameter and the spacing, give the leg counts in X and Y separately. As many cross ties as the leg counts require are added. A circular or hollow circular section takes a circular stirrup or a spiral (helix); with a spiral you also enter the winding pitch.
The stirrup layout does not only affect the section drawing. Choose Mander (Confined) for the core concrete and the lateral confining pressure is computed from the stirrup's diameter, spacing and leg count. Kent & Park (Confined) uses the volumetric ratio of the confining steel together with the core dimension. With either of these two confined concrete models, changing the stirrup also changes the constitutive curve of the core concrete.
While the longitudinal reinforcement option is off, the stirrup section is disabled.
Prestressing strands
Strand placement can be set to None, Layered or Circumferential. Which options are available to you depends on the section type and on whether you use longitudinal reinforcement.
| Section | Longitudinal reinforcement | Placement you can choose |
|---|---|---|
| Rectangular | on | None, Layered |
| Rectangular | off | None, Layered, Circumferential |
| Circular / Hollow circular | off | None, Circumferential |
| Circular / Hollow circular | on | Strand placement cannot be applied |
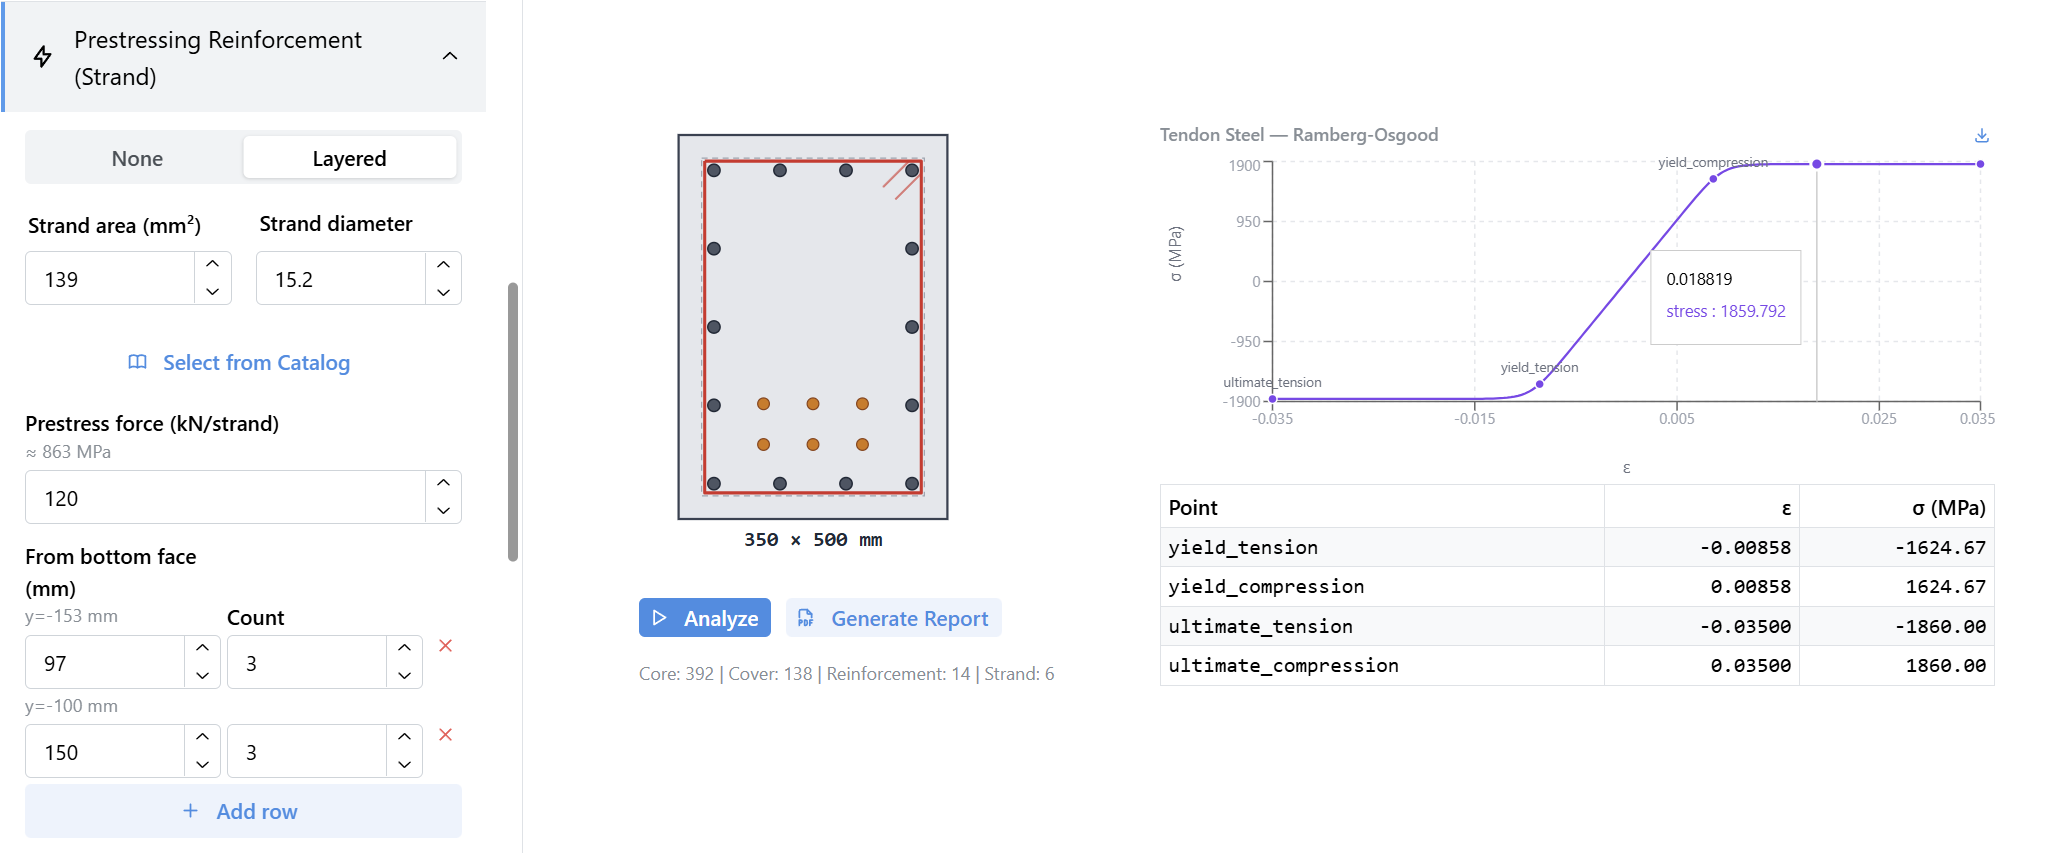
You can enter the strand area and diameter by hand, or use one of the standard strands through "Select from Catalog". Give the prestress force per strand in kN. The stress corresponding to the strand area you entered is shown in the interface. In the prestress force field, enter the effective force after the prestress losses.
In the layered placement, enter for each row the distance measured from the bottom face and the number of strands in that row. If you leave the horizontal edge clearance empty, the strand row is distributed evenly across the width. If you enter a clearance, the row is built leaving that distance from the left and from the right. In the circumferential placement on a rectangular section the corner strands are fixed and you give the number of intermediate strands added to the horizontal and vertical edges; on a circular section you give only the total strand count.
The strand steel fields at the bottom of the section are where you define the ultimate tensile strength and the modulus of elasticity.
Material grades and constitutive models
You choose the material grade of the core concrete, the cover concrete and the reinforcing steel separately. Each of the three has two modes. In Catalog mode you pick the standard (TS500 / TBDY, Eurocode 2 or ACI 318), the grade and the constitutive model. In Custom mode you enter the strength values directly.
| Concrete constitutive model | What it can be used for |
|---|---|
| Hognestad | Expected behaviour of unconfined concrete |
| Mander (Unconfined) | Cover concrete, with its post-crushing branch |
| Mander (Confined) | Core confined by stirrups; the confining pressure is computed from the stirrup layout |
| Kent & Park (Confined) | A second confined-core model; the confining pressure is computed from the confining steel ratio |
| OpenSees Concrete02 | A curve carrying tensile strength and tension softening |
| Equivalent Rectangular Block (TS500 / ACI 318) | Code-based equivalent ultimate-strength compression block |
| Parabola-Rectangle (EC2) | Design model based on EN 1992-1-1 |
For the reinforcing steel you can choose the elastoplastic, bilinear, trilinear or OpenSees Steel02 curve.
Because the core and the cover take separate models, you can analyse a confined core together with an unconfined cover.
⚠️ The equivalent rectangular block is defined only at the ultimate state (at the maximum compressive strain). Choose it and moment-curvature is not computed — the tab explains this in place of the curve. It is no obstacle to computing the interaction diagram.
Material factors
The concrete material factor and the steel material factor sit at the bottom of the same section, both defaulting to 1.0. The factor applies to the stress read off the material curve: at every strain the stress is divided by it, and the strain axis stays where it is. A value of 1.0 means the curve is used as it is.
If you want an analysis run on the design strengths of the materials, enter the factors by hand. For TS 500 you can use and .
Analysis parameters
Enter the axial load acting on the section in kN. Axial compression must be entered as positive. The bending angle runs from 0° to 359°, where 0° is bending about the horizontal axis.
These two values are used in the moment-curvature analysis. The interaction diagram is not affected by them, because that calculation automatically sweeps the axial levels between the section's pure tension and pure compression capacities and solves the section at every bending angle to build a three-dimensional surface.
Running the analysis
To run the section analysis, press Analyze on the 'Section' tab. If any input is invalid the button stays disabled and the reason appears under the field concerned.
One button gives you both the moment-curvature curve and the N-M interaction surface. The fiber mesh is generated from the section geometry automatically, with no separate step. When the run finishes the screen moves to the Moment-Curvature tab and the material curves load in the background.
Reading the moment-curvature results
The slider at the top of the tab lets you step through the curvature increments, or animate them from start to finish. The curvature, moment value and neutral axis depth of the step you select are read off to the right of the slider, and a step that did not converge is flagged in red.
The moment-curvature curve is on the left, and you can select a state by clicking the curve itself. On the right you get the stress distribution over the section for the selected state, together with its strain and stress profiles. The M-K table below carries every step: click a row to jump to that state, or download the table as CSV. Beside it the Result Summary gives the peak moment, the yield moment, the yield curvature, the ultimate moment, the ductility ratio and the effective stiffness.
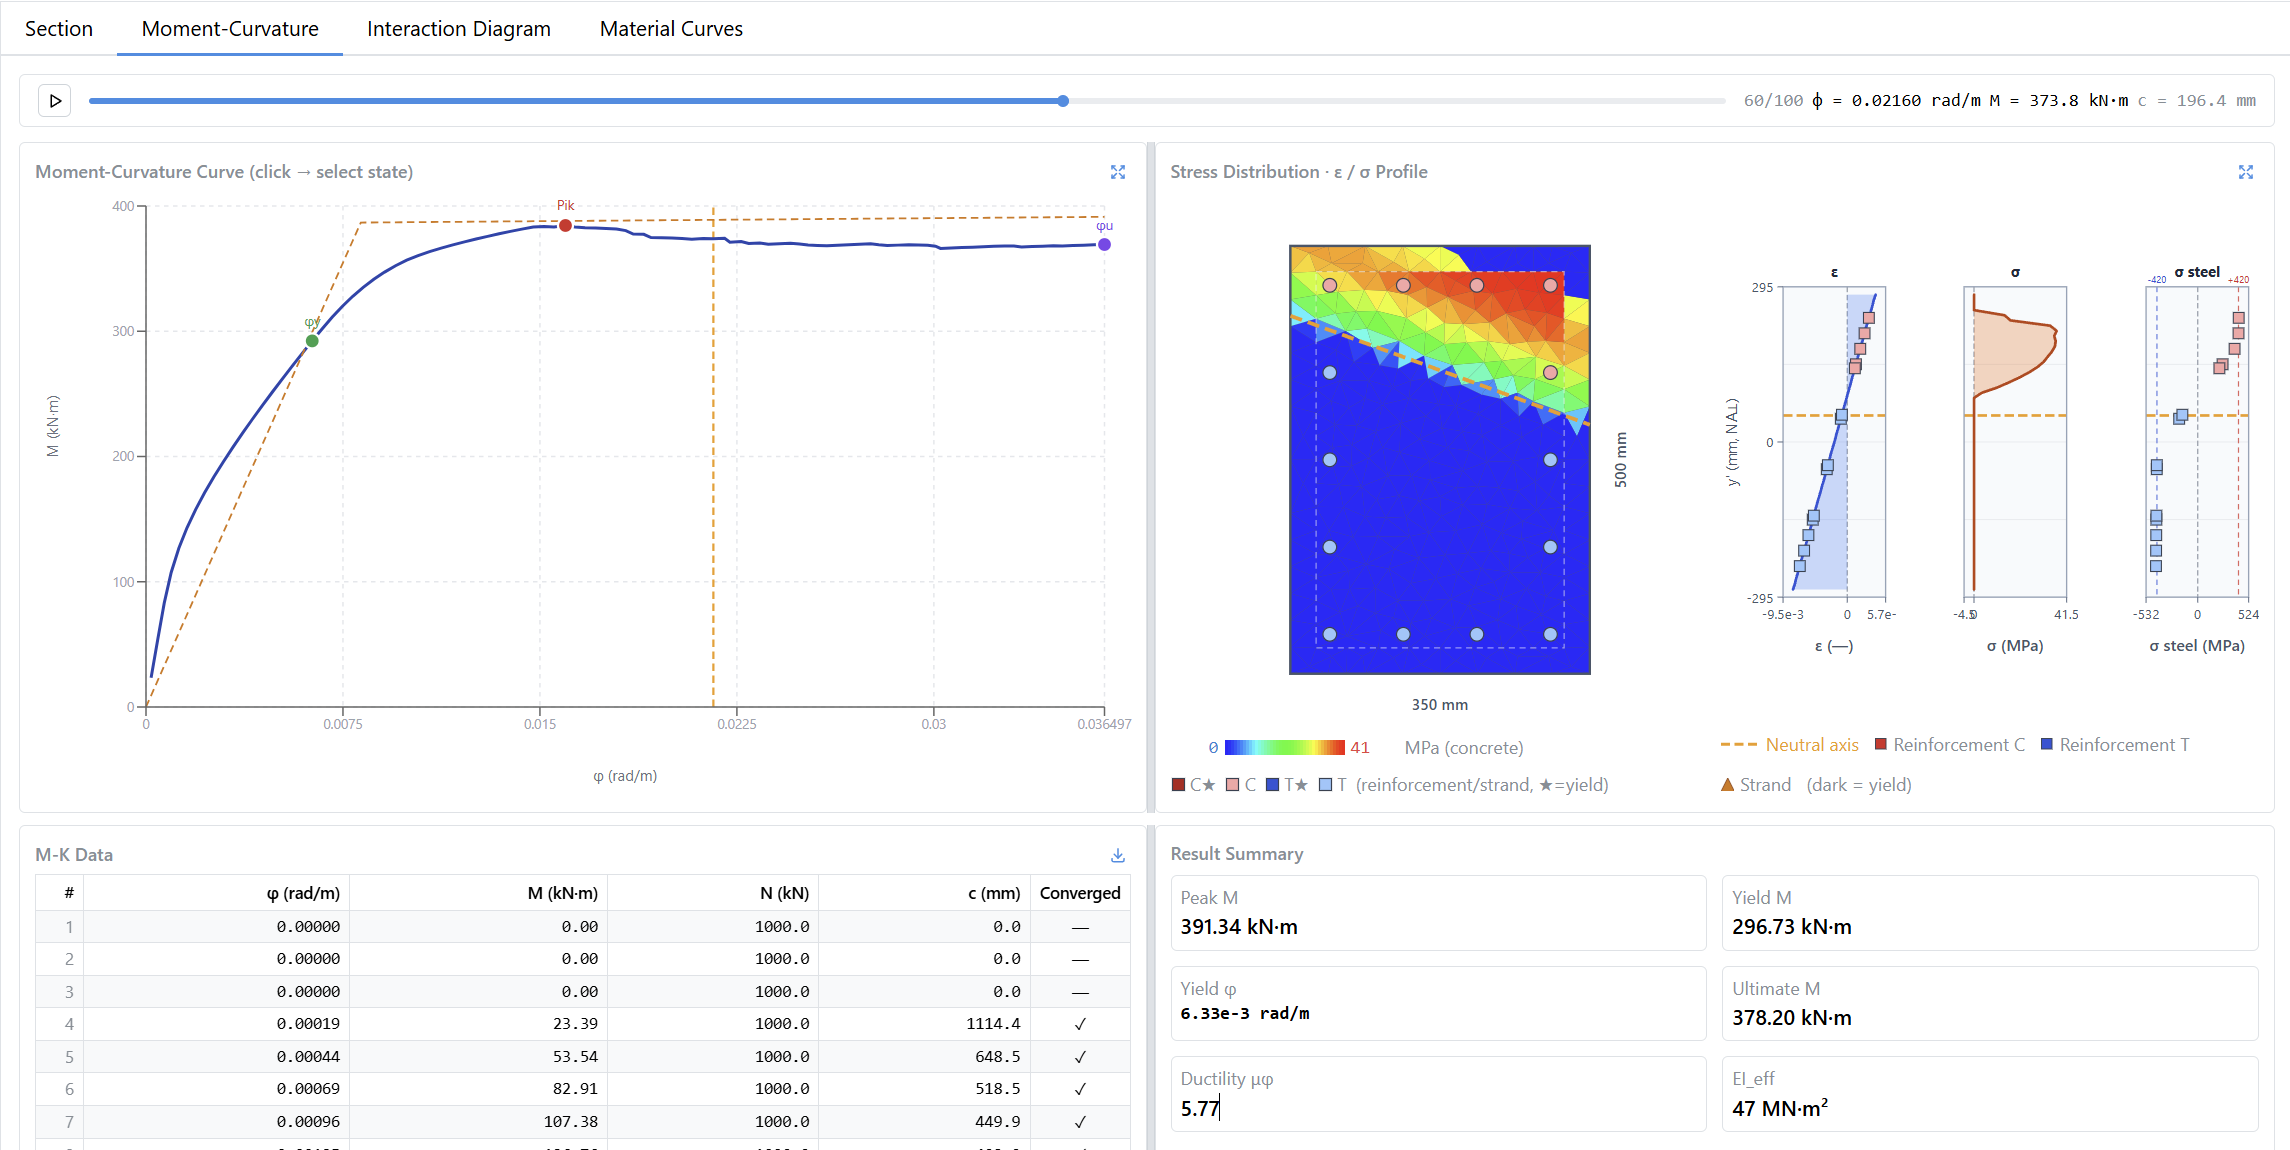
The fiber stress state is not written to the saved calculation — it is produced when you need it. Start it with "Compute fiber state" on the right-hand panel, or with the play button to the left of the slider. If your results are out of date the state cannot be computed and you have to re-run the analysis first.
Reading the interaction diagram
The four cards at the top of the tab give the section's limiting values: pure compression, pure tension, the balance axial load and the maximum moment.
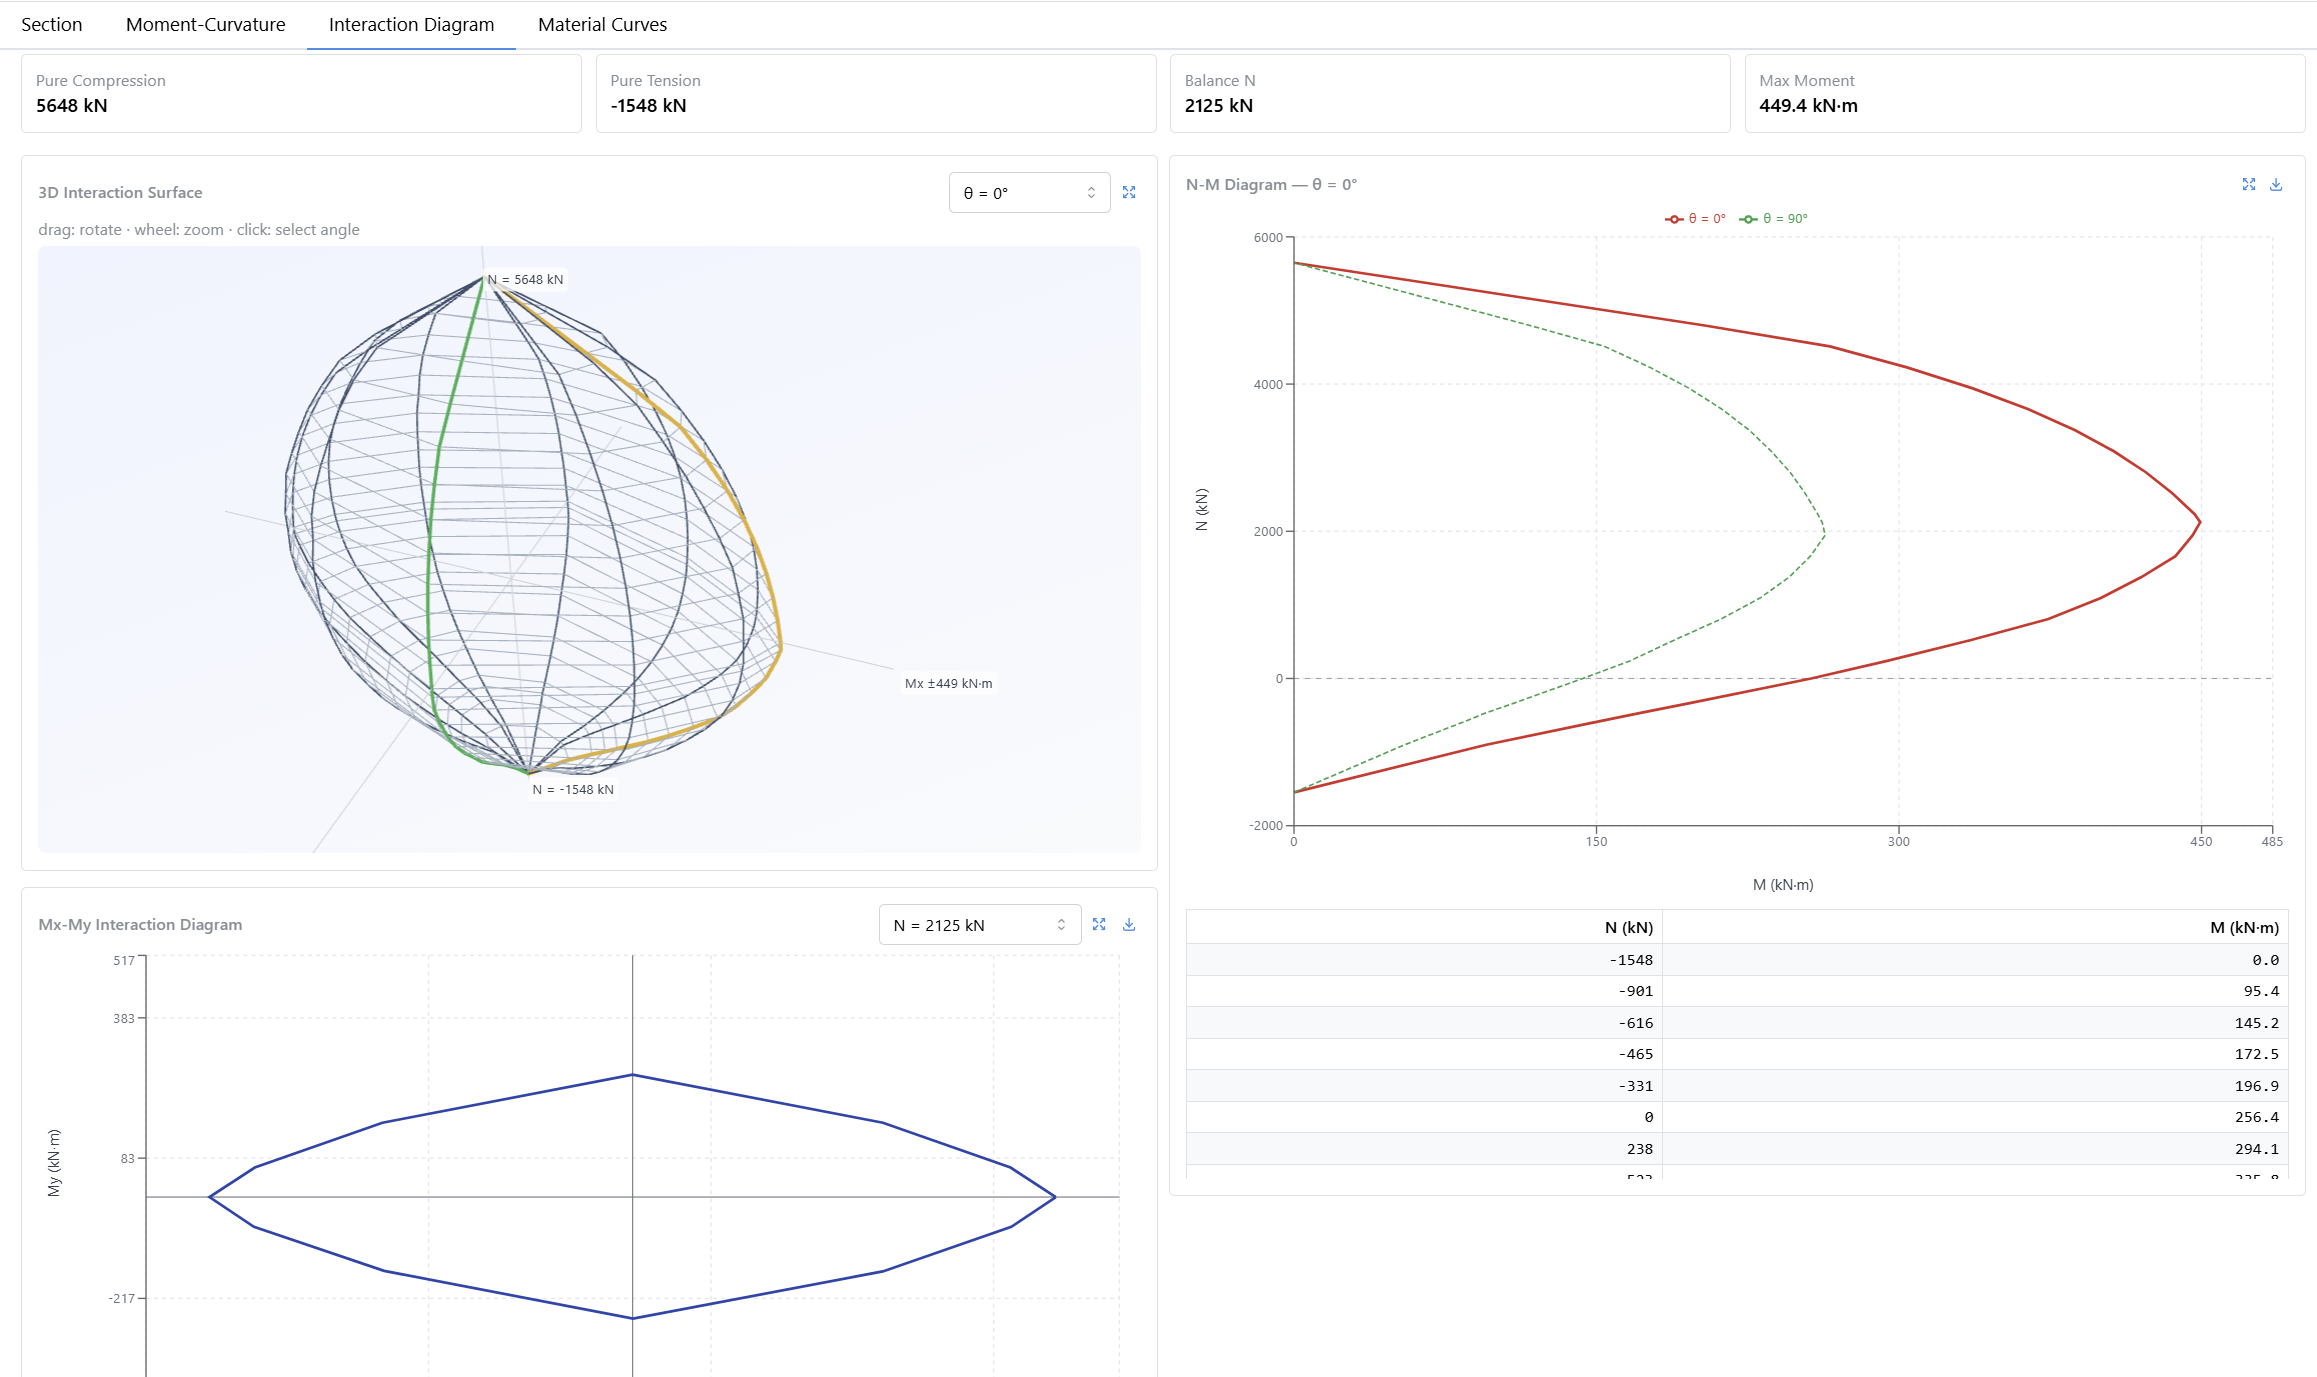
The 3D interaction surface is at the top left. Drag to rotate it, use the wheel to zoom, and click the surface to select that meridian's angle. The same angle is available from the list at the top right of the panel.
The N-M diagram on the right always shows the 0° and 90° curves, with the angle you selected drawn over them in a separate colour. The table beneath it carries the axial load and moment pairs for that angle.
When you select an axial level in the Mx-My interaction diagram at the bottom left, you see the section's closed moment contour at that level. That is the diagram you assess a section under biaxial bending with.
Every panel can be enlarged and the data it carries downloaded as CSV. The interaction diagram is kept in the saved calculation, so when you reopen it you can view the diagram without re-running the analysis.
Material curves
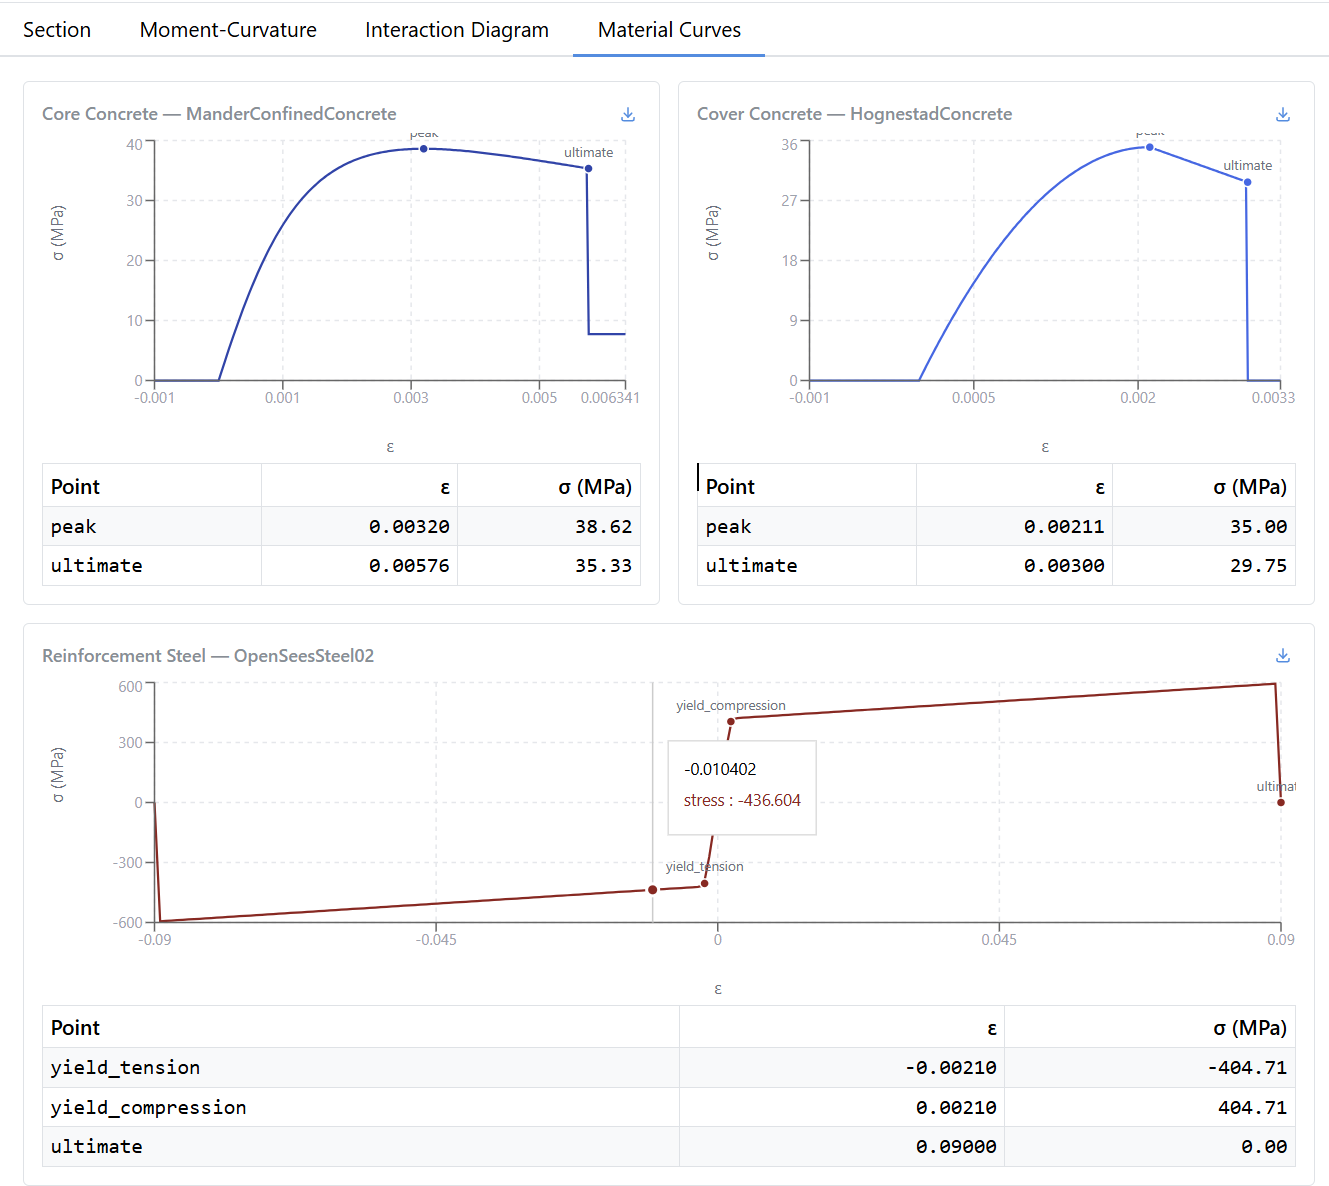
The curves load automatically once the analysis finishes. The tab holds separate plots for the core concrete, the cover concrete and the reinforcing steel, and adds the strand steel when the section carries strands. Each curve's numerical data can be downloaded as CSV.
The confined core curve is drawn with the confining pressure computed during the analysis, so the curve on this tab is the one the section was actually solved with.
Generating the report
Generate Report on the Section tab produces the PDF. It has nine sections.
| Section | Contents |
|---|---|
| 1. Section and Reinforcement | Geometry, longitudinal bars and strands |
| 2. Section Drawing | Section geometry and bar placement |
| 3. Material and Analysis Parameters | The grades, models and material factors you chose, the axial load and the bending angle |
| 4. Moment-Curvature Analysis | The moment-curvature curve |
| 5. Moment-Curvature Summary | Yield, peak and ultimate values with the ductility and effective stiffness |
| 6. Section Fiber State and Profiles | Fiber stresses at the yield and ultimate states with the profiles |
| 7. Section Interaction Diagram (N-M) | The 0° and 90° interaction diagrams |
| 8. Mx-My Interaction Contours | Contours at several axial levels |
| 9. Material Stress-Strain Curves | The material curves you used |
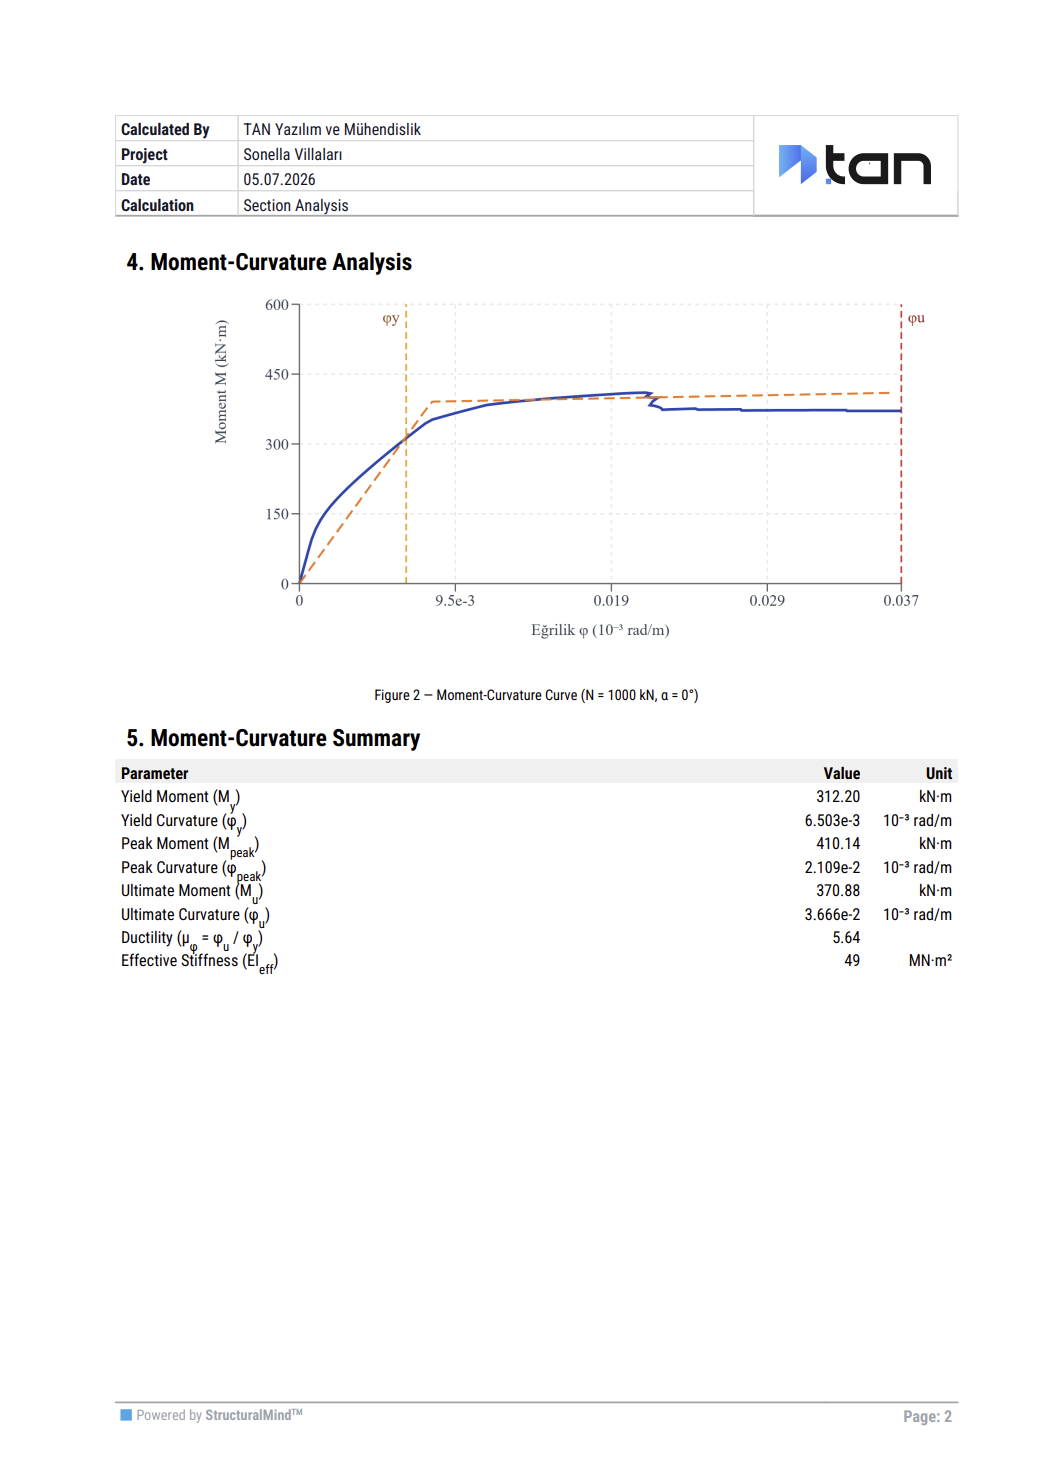
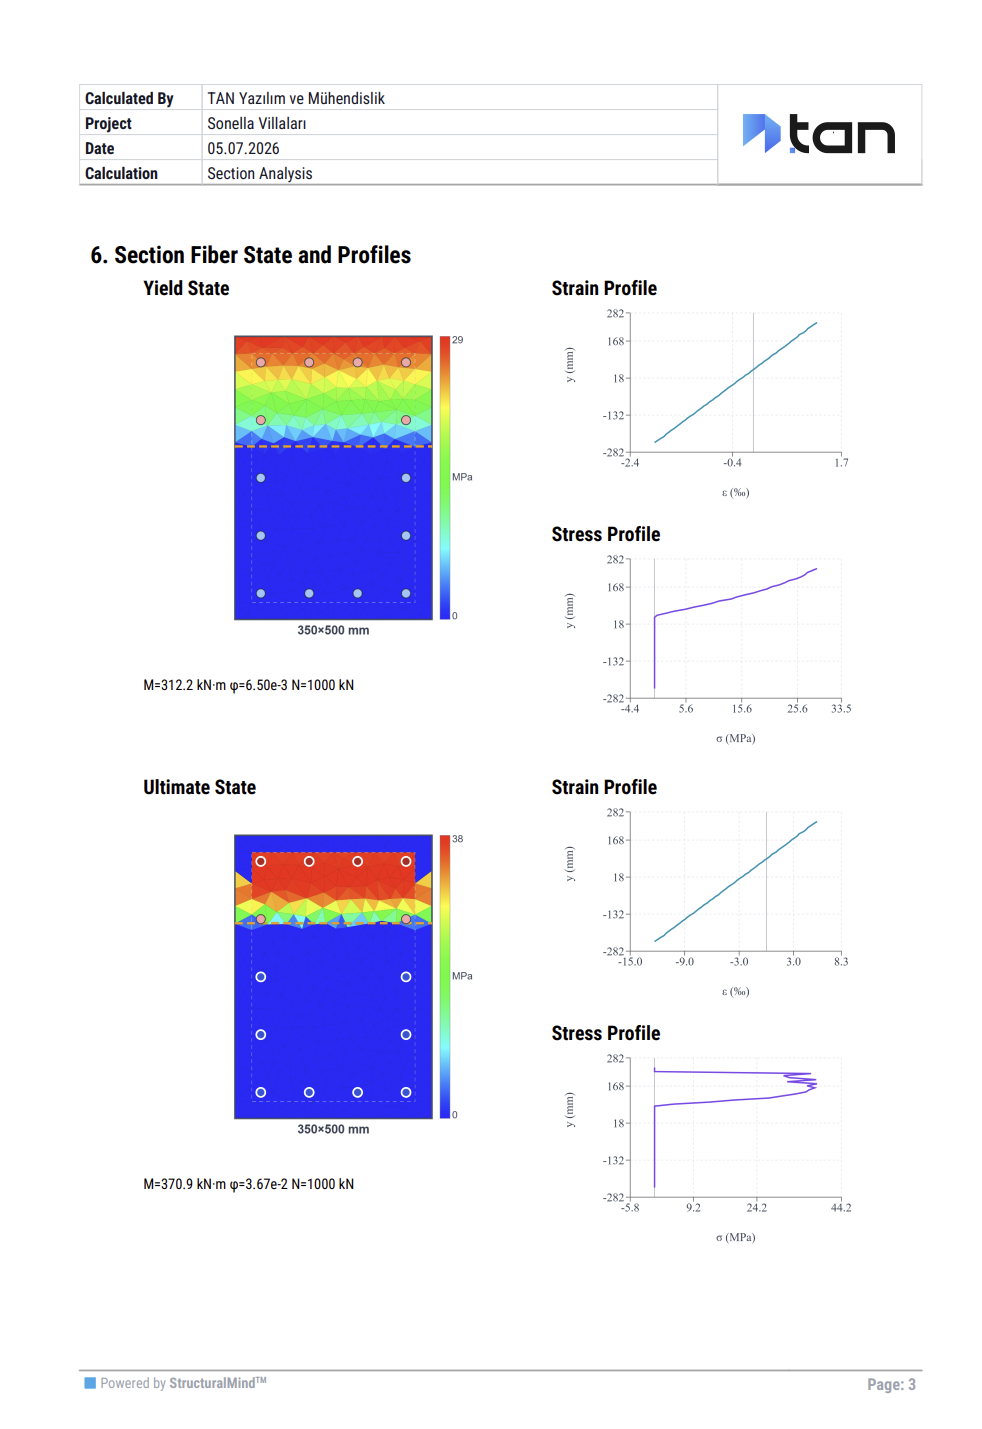
The report follows the language of the interface: run a calculation in the English UI and the report comes out in English.
The fiber stress states the report needs are produced while the report is being assembled, even if you never computed them on screen. Nothing extra is asked of you.
Whether the results are current
The state of your result is shown under the input panel.
| State | What it means |
|---|---|
| Analyzed | The saved result is current. The engine version and the time of the run are shown with it |
| Inputs changed | You changed an input after the analysis, so the results no longer belong to the section on screen |
| Older engine version | The result was produced with an earlier version of the calculation engine |
Producing a report and computing the fiber state both require a current result. In the other two states, refresh the calculation with Analyze first.
When you need a code check
This macro gives you a section's expected behaviour; it produces no code verdict. If the same section needs an ultimate-strength check, a shear and torsion check, or its detailing rules tested, use the Column Design macro. The interaction diagram behind that macro's strength check comes from this engine.
How the calculation works, which assumptions it makes and what it leaves out are covered on the Section Analysis and Section Analysis — Verification pages.